Confidence Intervals are useful tool for expressing the uncertainity around an estimate.
confidence interval
statistics
Author
Vidyasagar Bhargava
Published
December 5, 2022
Imagine you want to estimate the average height of all the adults. It’s very impractical to measure average height of all adults. So you take a sample of 100 adults and measure their average height to be 5’7 inches. Now you know that this is just a estimate and if you took another sample, you might get different average. So how can you express the uncertainty around your estimate?
Confidence Intervals
A confidence interval is a range of values, derived from the sample data, that is likely to contain the true value of an unknown population parameter. For example you can say you are 95% confident that the average height of all adults is between 5’5 and 5’9 inches. This is 95% confidence interval.
How to calculate
\[
\bar{x} \pm z\cdot \frac{s}{\sqrt{n}}
\]
where \(\bar{x}\) = sample mean, \(s\) = sample standard deviation, \(z\) = confidence level value and \(n\) =sample size
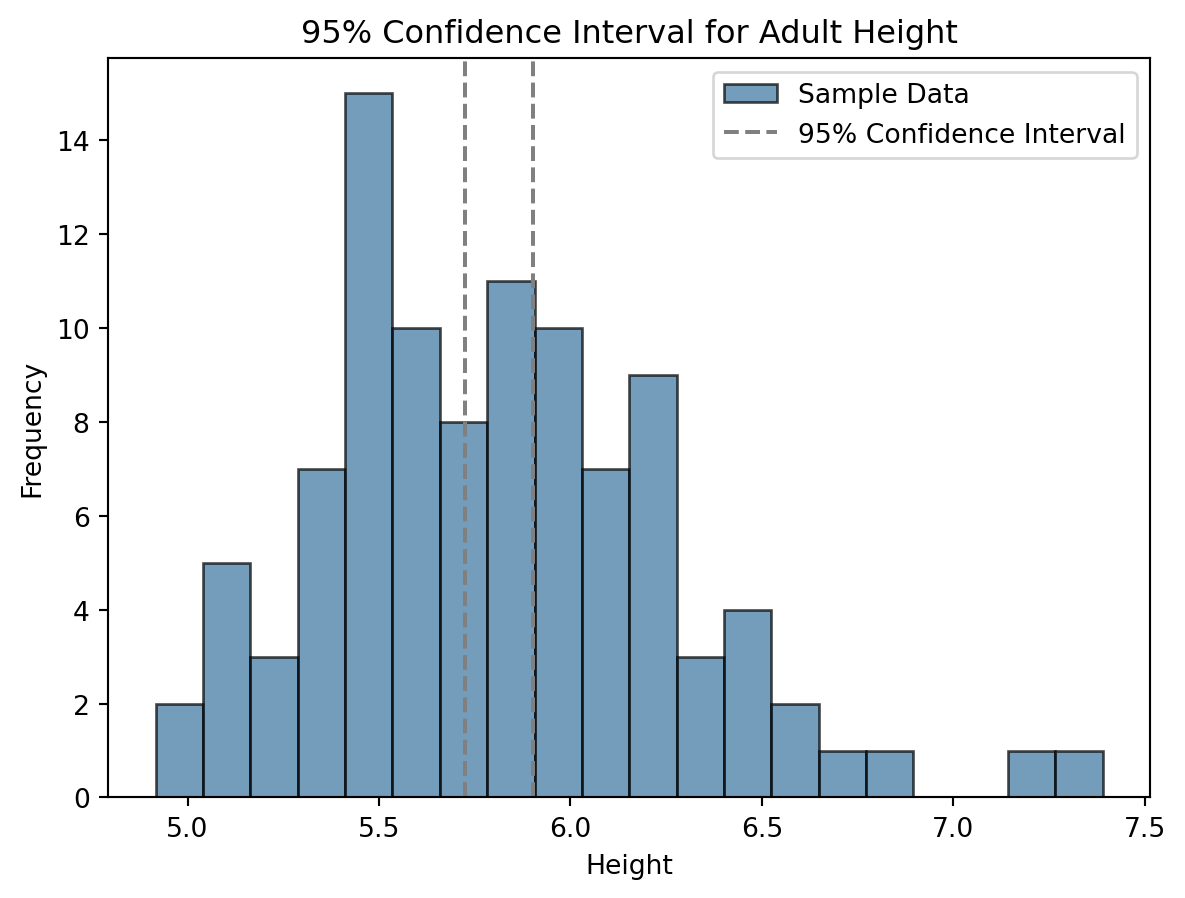
import numpy as npimport matplotlib.pyplot as pltfrom scipy.stats import norm# Example datadata = np.random.normal(loc=5.8, scale=0.5, size=100) # Calculate mean and standard deviation of the samplemean_value = np.mean(data)std_dev = np.std(data)# Calculate the standard error of the mean (SEM)sem = std_dev / np.sqrt(len(data))# Calculate the margin of error for a 95% confidence intervalmargin_of_error = norm.ppf(0.975) * sem# Calculate the confidence intervalconfidence_interval = (mean_value - margin_of_error, mean_value + margin_of_error)# Plotting the dataplt.hist(data, bins=20, alpha=0.7, color='#39729E', edgecolor='black', label='Sample Data')# Plotting the confidence intervalplt.axvline(x=confidence_interval[0], color='grey', linestyle='--', label='95% Confidence Interval')plt.axvline(x=confidence_interval[1], color='grey', linestyle='--')# Adding labels and titleplt.xlabel('Height')plt.ylabel('Frequency')plt.title('95% Confidence Interval for Adult Height')# Adding legendplt.legend()# Show the plotplt.show()
Interpretation
Saying “I am 95% confident that the average height is between 5’5 and 5’9 inches” doesn’t mean that there is 95% chance that the true average falls in this range. Instead it means that if you were to take many samples and compute a 95% confidence interval for each one, about 95% of these intervals would contain the true average height.
Choosing CI
In order to choose confidence interval you should look into consequences of being wrong, if consequences are severe you might choose 99% CI else 95% is very common.
Higher CI level results in wider intervals and vice versa. So there is always a trade off between precision and confidence.
Limitations
CI assumes that your data is normally distributed but which may not always be the case.